
Memory Efficiency in iOS: Metrics
Make responsive and performant apps

Overview
Sooner or later any developer is facing the memory issues. Either it will be a leak, EXC_CRASH (SIGABRT) or termination because of memory usage violation. In this guide we will focus on latest one and will tackle it from the beginning. We will start with wrap-up of official docs and then will learn what to do with large memory consumption in the next part.
Why is it important?
OS devices have limited RAM, which is shared between apps, the OS, and system processes. To manage memory pressure, iOS may move background apps’ data to storage, slowing them down when resumed. Apps consuming too much memory trigger warnings, logged as crash reports with an EXC_RESOURCE exception type and MEMORY subtype, before iOS forcefully terminates them. Foreground app terminations are user-visible and require a full relaunch, affecting performance. Excessive memory use not only risks an app’s stability but can degrade the overall device experience (because RAM is shared and other apps might be terminated ), so it’s crucial to keep memory usage lean.
Memory Metrics
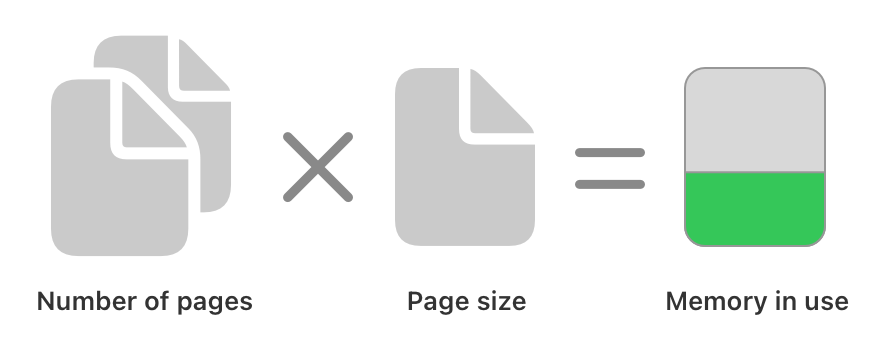
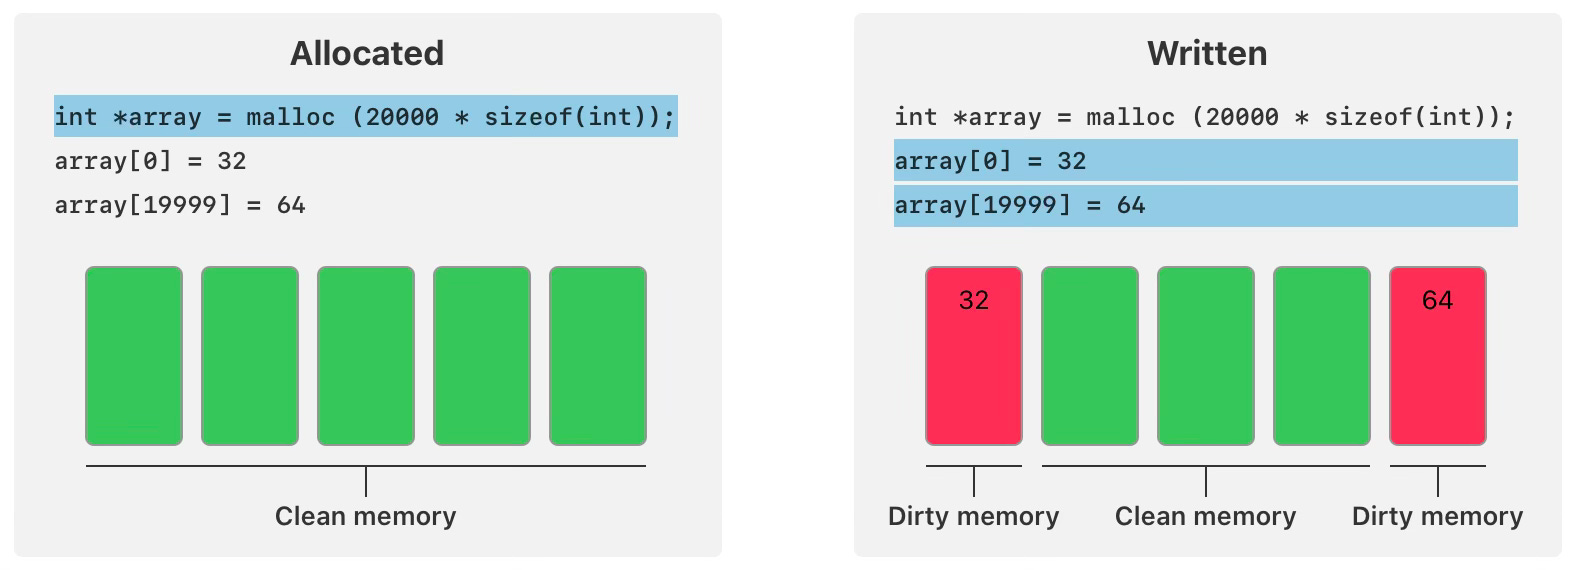
Memory usage is calculated as the number of pages (typically 16 KB each) multiplied by page size. Even writing one byte to a new memory page can increase usage by 16 KB. Memory mapped from the app’s executable or libraries/frameworks immediately contributes to this metric. However, runtime-allocated memory only counts toward usage when it’s written to, marking it “dirty” and requiring dedicated RAM. Related Apple Doc here.
Keep in mind: Physical memory (RAM) is not equal to Allocated Virtual Space of the app. It might be much (and usually is) bigger then the physical one.
Where to view it?
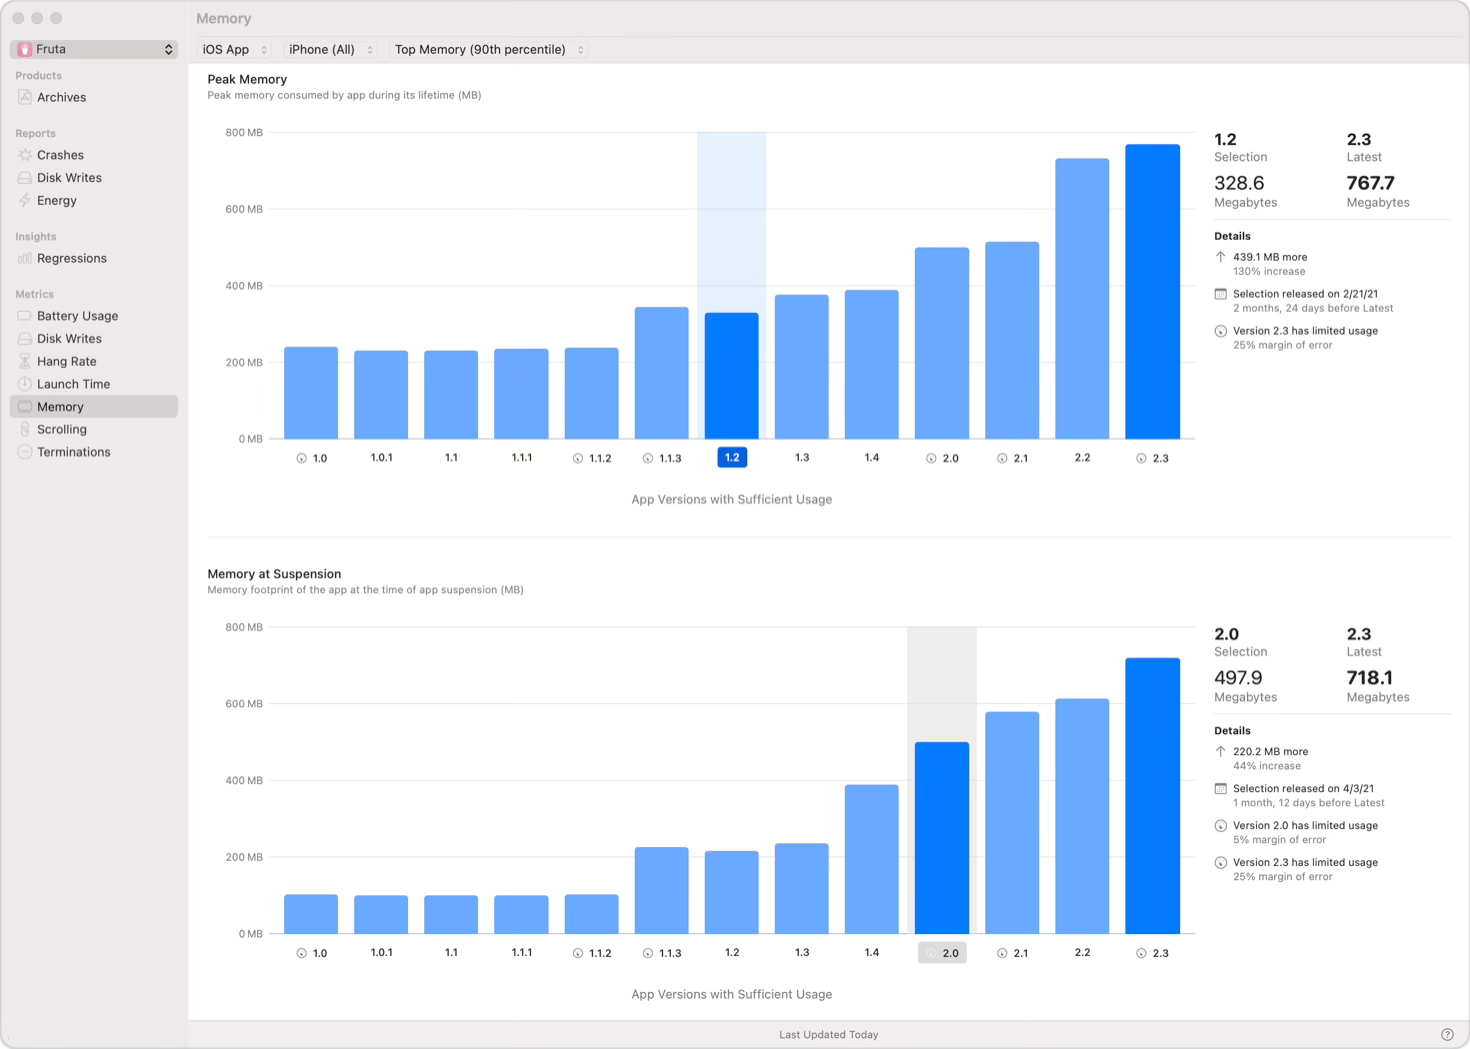
This data is available in the Memory pane of the Xcode Organizer window or by using MetricKit. Below is the Fruta app from latest WWDC:
That’s what we can get with significant amount of usage data. Otherwise we will see:
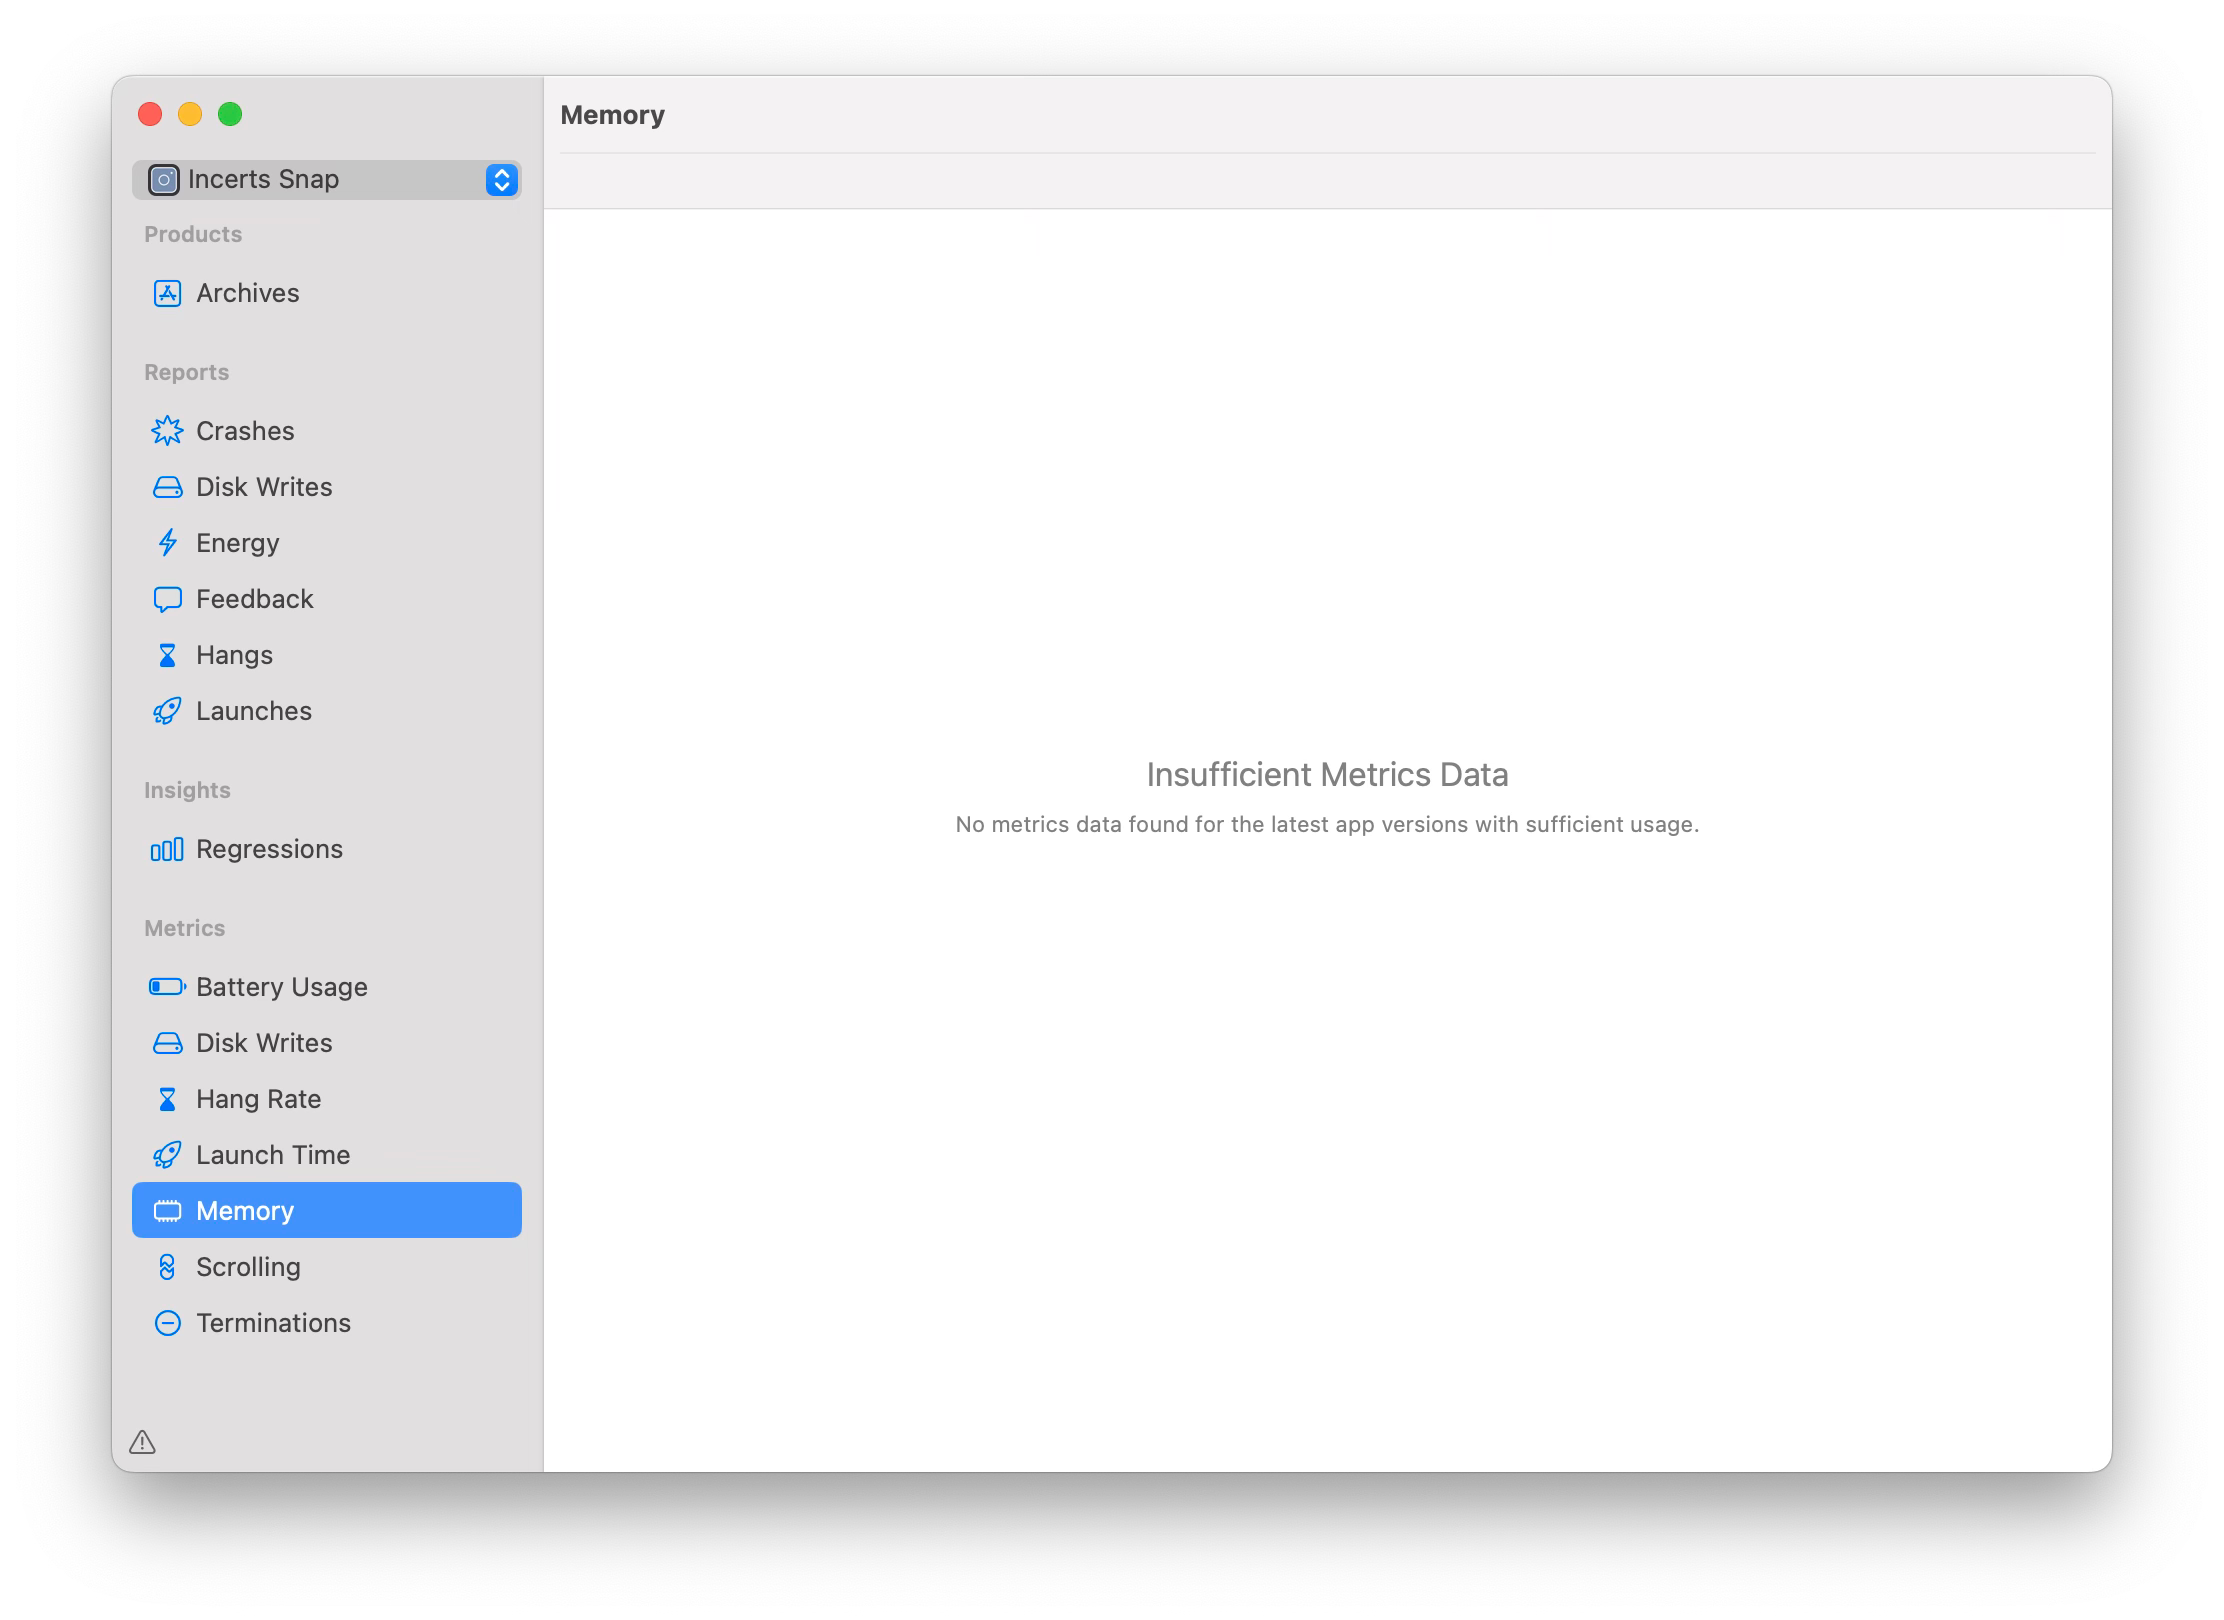
This information is good for public and live apps. Where to get the actual usage during Debug sessions? Let’s check.
Memory usage while Debugging
Our main helper here is Xcode and additionally Instruments tool. If you are not familiar yet with Instrument:
Xcode’s Debug navigator
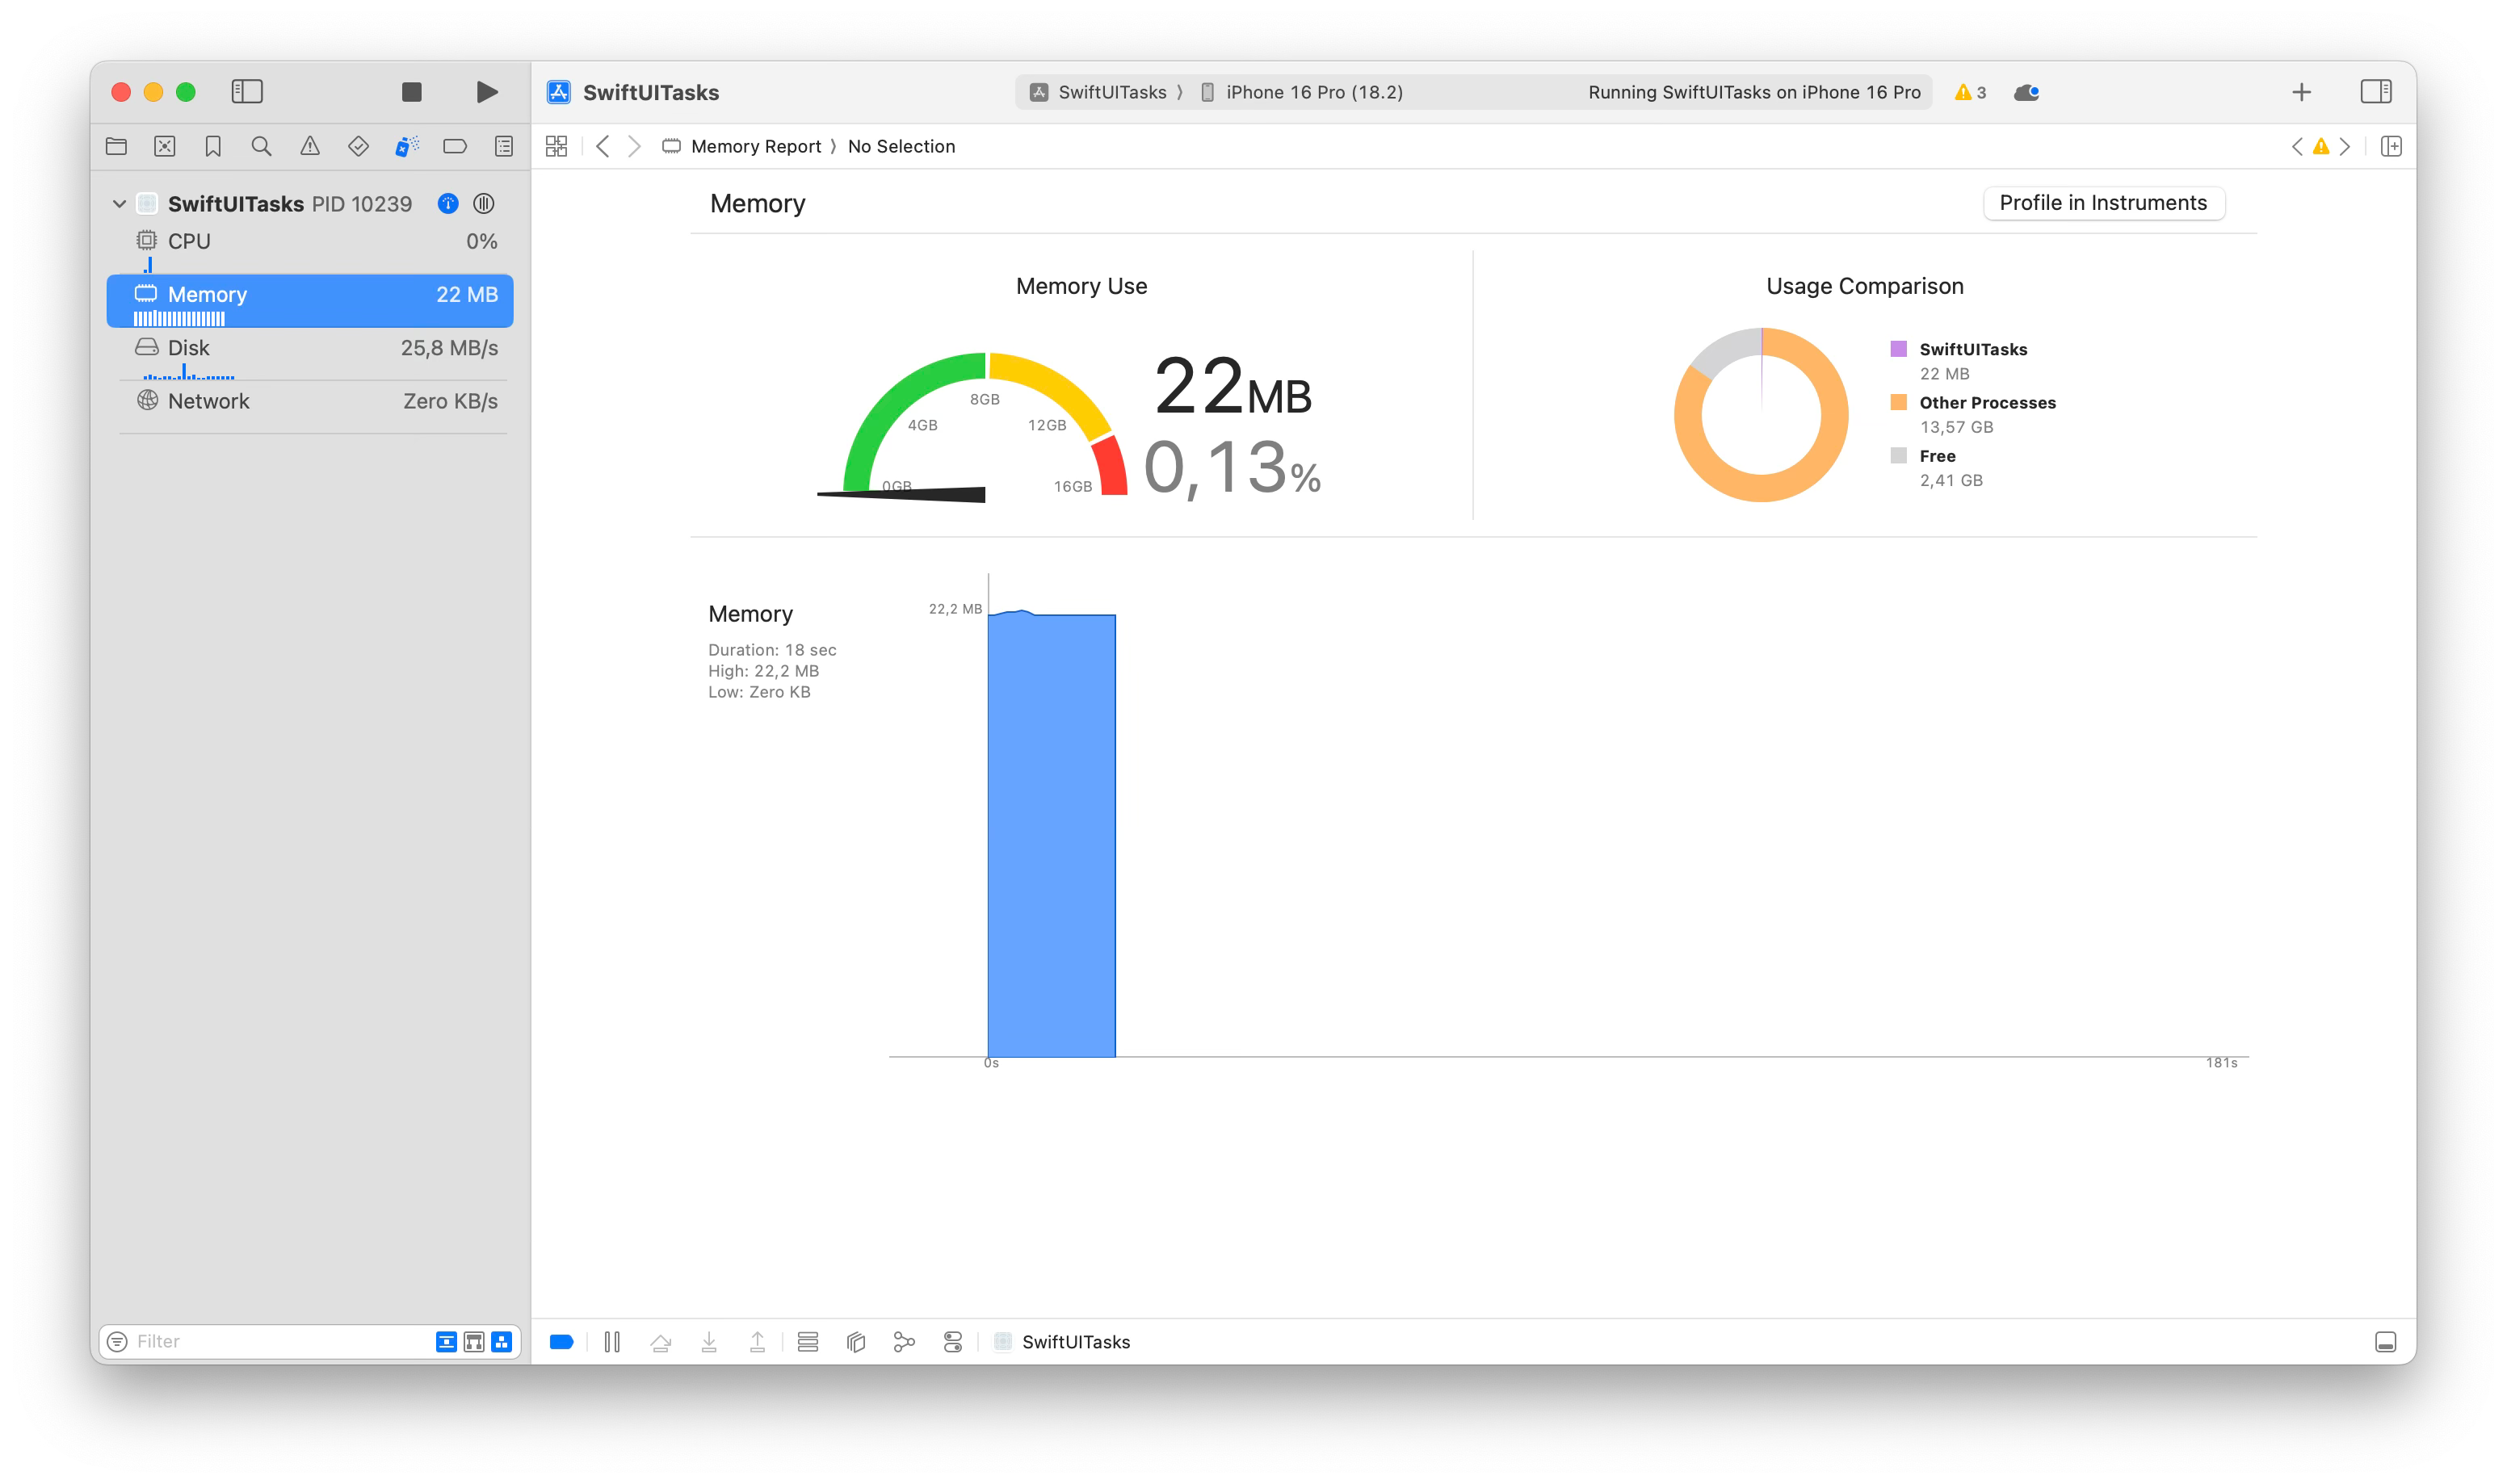
While running your app in Xcode, the Debug navigator’s memory report shows both current and peak memory usage. The yellow area of the memory gauge signals high memory use that could trigger a warning. If memory usage enters the red zone, the app risks being terminated by iOS. 22 MB in example below, is actual memory footprint/usage. The one we‘ve discussed above in Allocated/Dirty terms.
Be aware! Famous “It works on my machine“ phrase is relevant here like never before. You might have 64Gb of RAM (or 16Gb like on screenshot above) and application will feel fine. No pressure, no other heavy apps like Figma, Adobe AfterEffects are running. But real devices doesn’t have such big capabilities. According to this list which is lacking iPhone 16 (he holds 16Gb) it’s not even 16Gb! Apple docs even has a Tip about it:
If iOS repeatedly terminates your app because it’s using too much memory, you can investigate its behavior in the simulator, where it can continue to run. When you run your app in the simulator, the memory gauge always stays in the green (safe) region because macOS doesn’t issue memory warnings or out-of-memory terminations. This behavior has advantages in diagnosing problems associated with too much memory use. But keep in mind that memory use in the green region of the gauge in the simulator doesn’t necessarily mean that your app’s memory use is within safe limits.
Recommended to test on real device if you think that peak memory might be high - UI will remain the same. Sooner the better.
Memory Graph
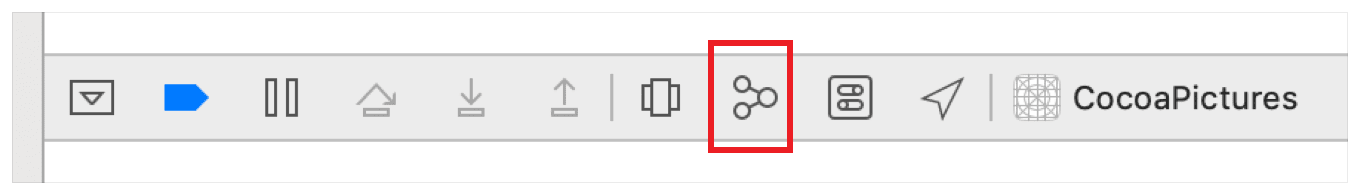
Next tool from Xcode is Memory graph. Click the Debug Memory Graph button in Xcode’s debug area to generate a memory graph showing your app’s objects and allocations.
The memory graph visualizes your app’s memory regions and their sizes. Each node represents an object, heap allocation, or memory-mapped file, while arrows show references between regions.
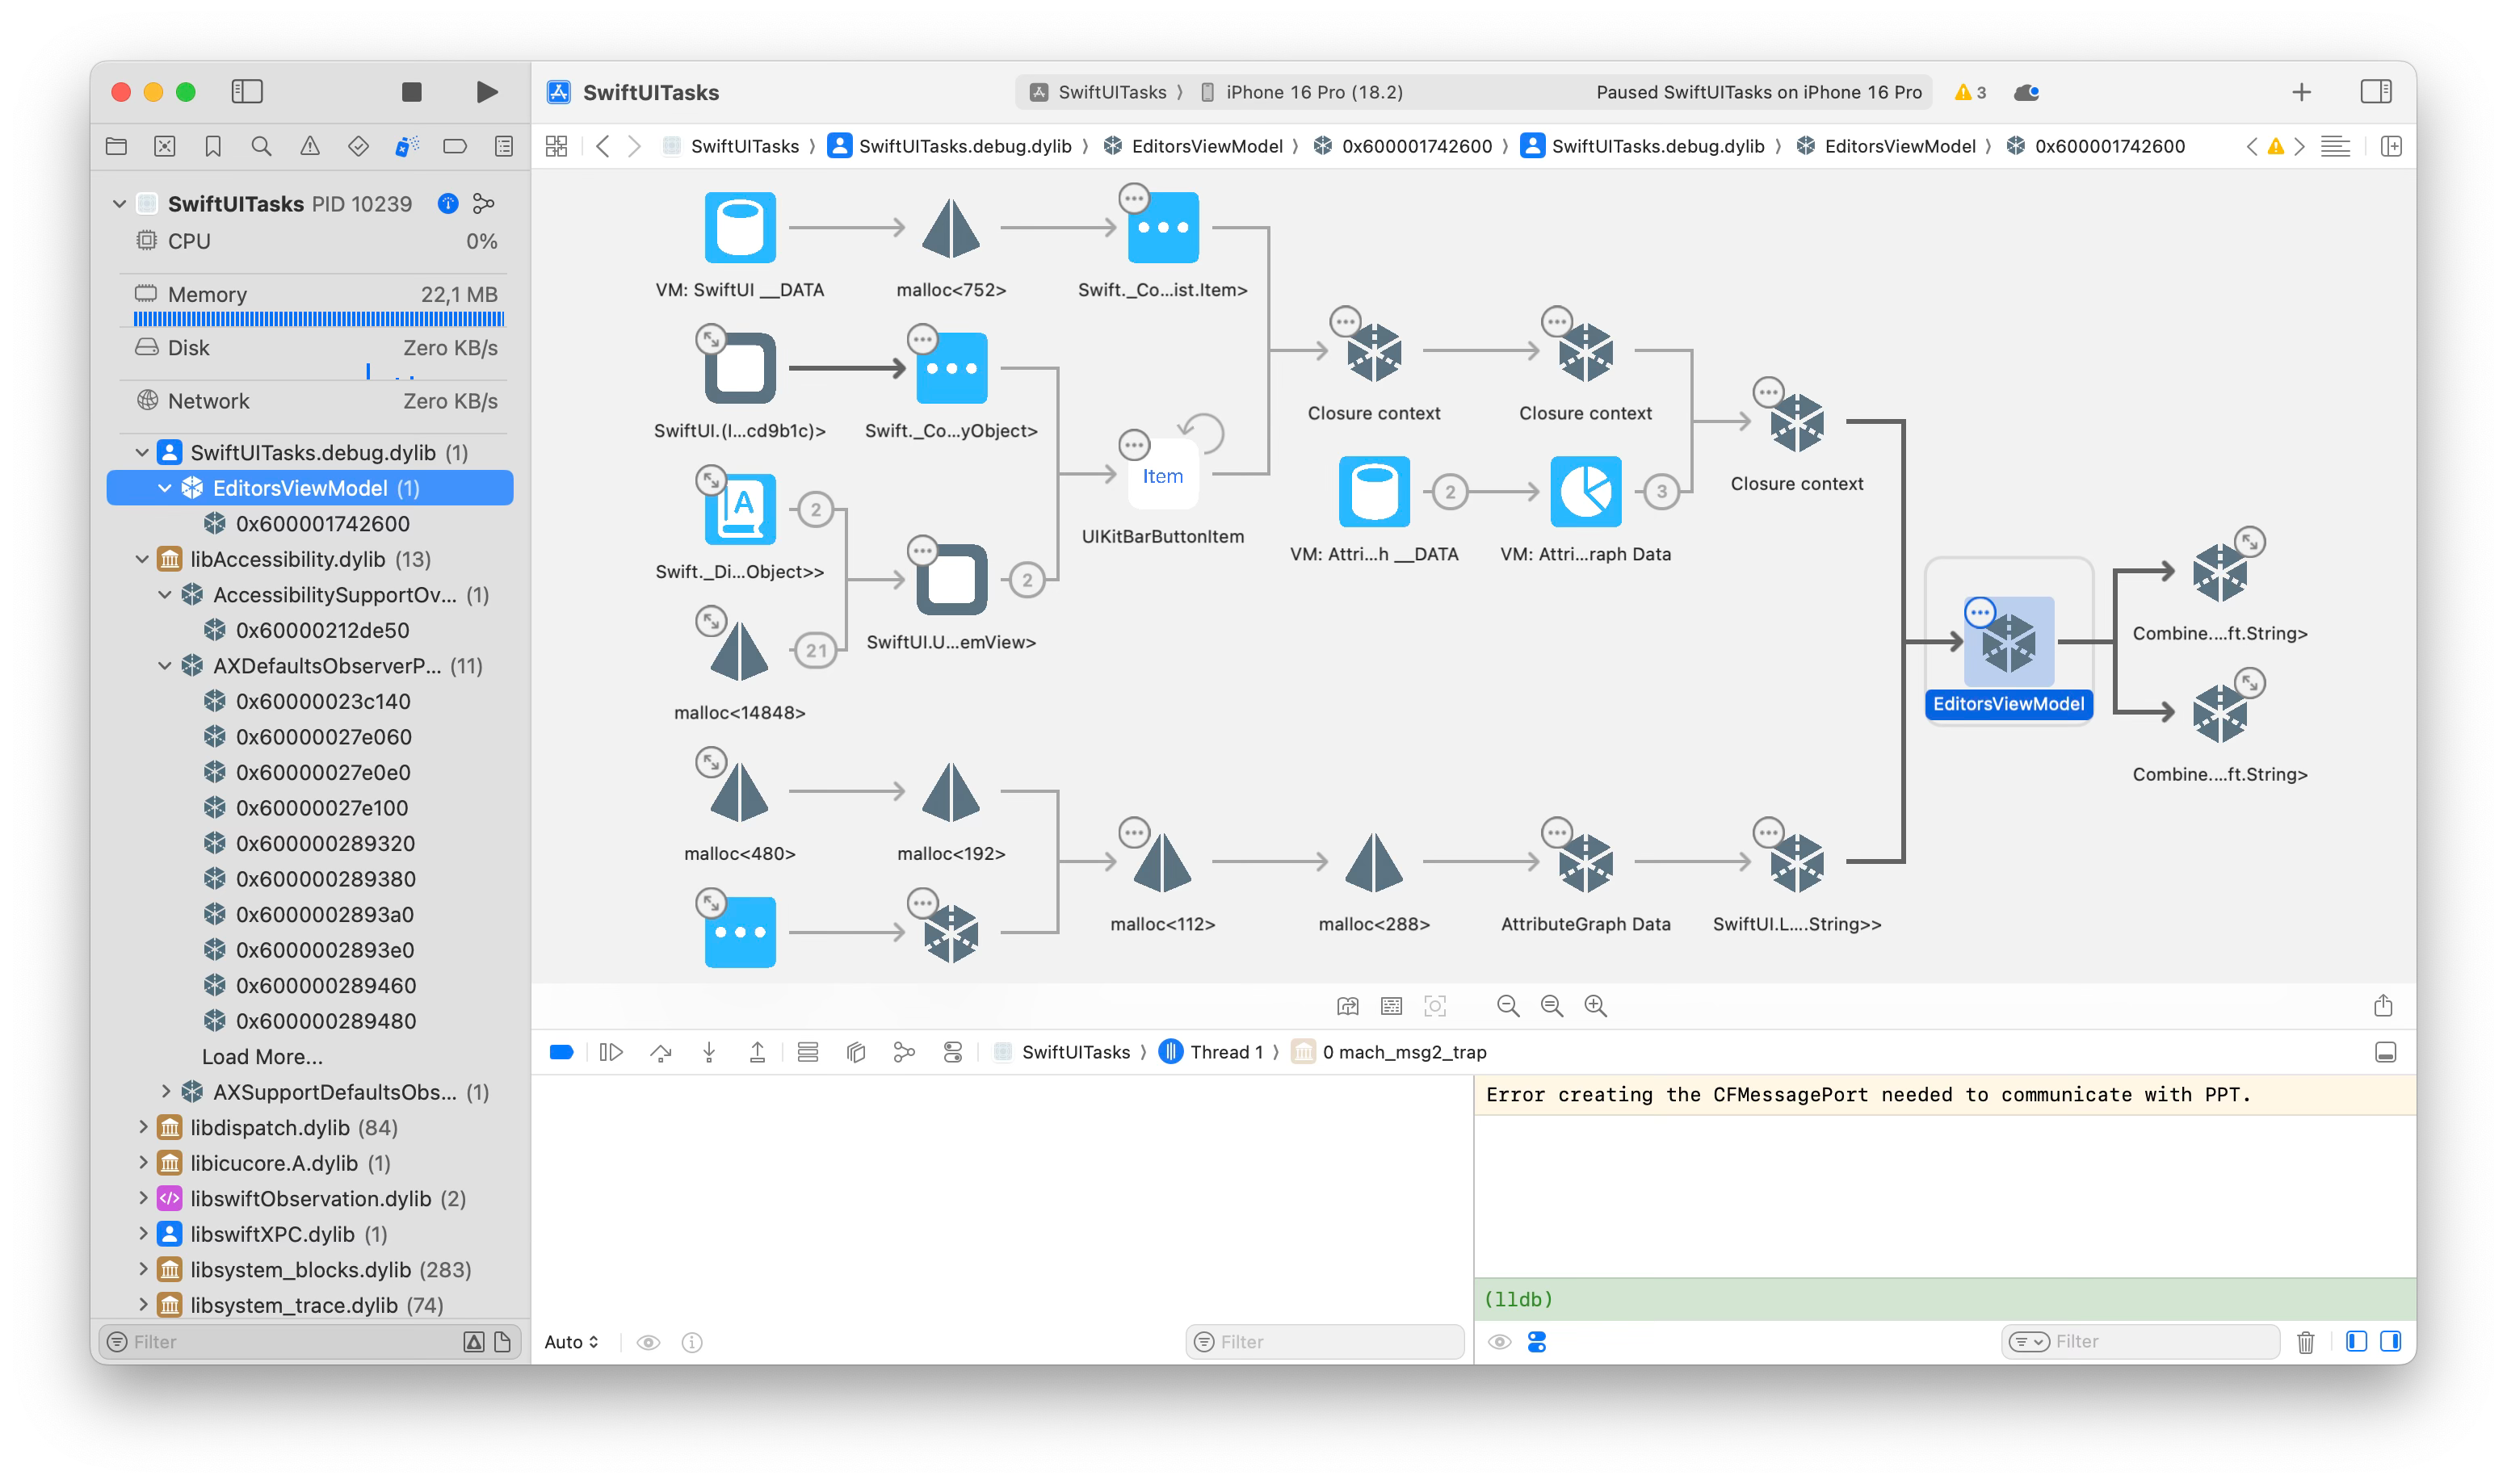
The memory graph reveals where your app is using memory and how allocations are connected. You can enhance it by enabling allocation stack traces, which link each region to the call stack that created it. To enable this, check Malloc Stack in your scheme’s Run Diagnostics. With stack traces enabled, the graph shows stack trace details for each node, letting you tie memory allocations to specific functions and methods in your code.
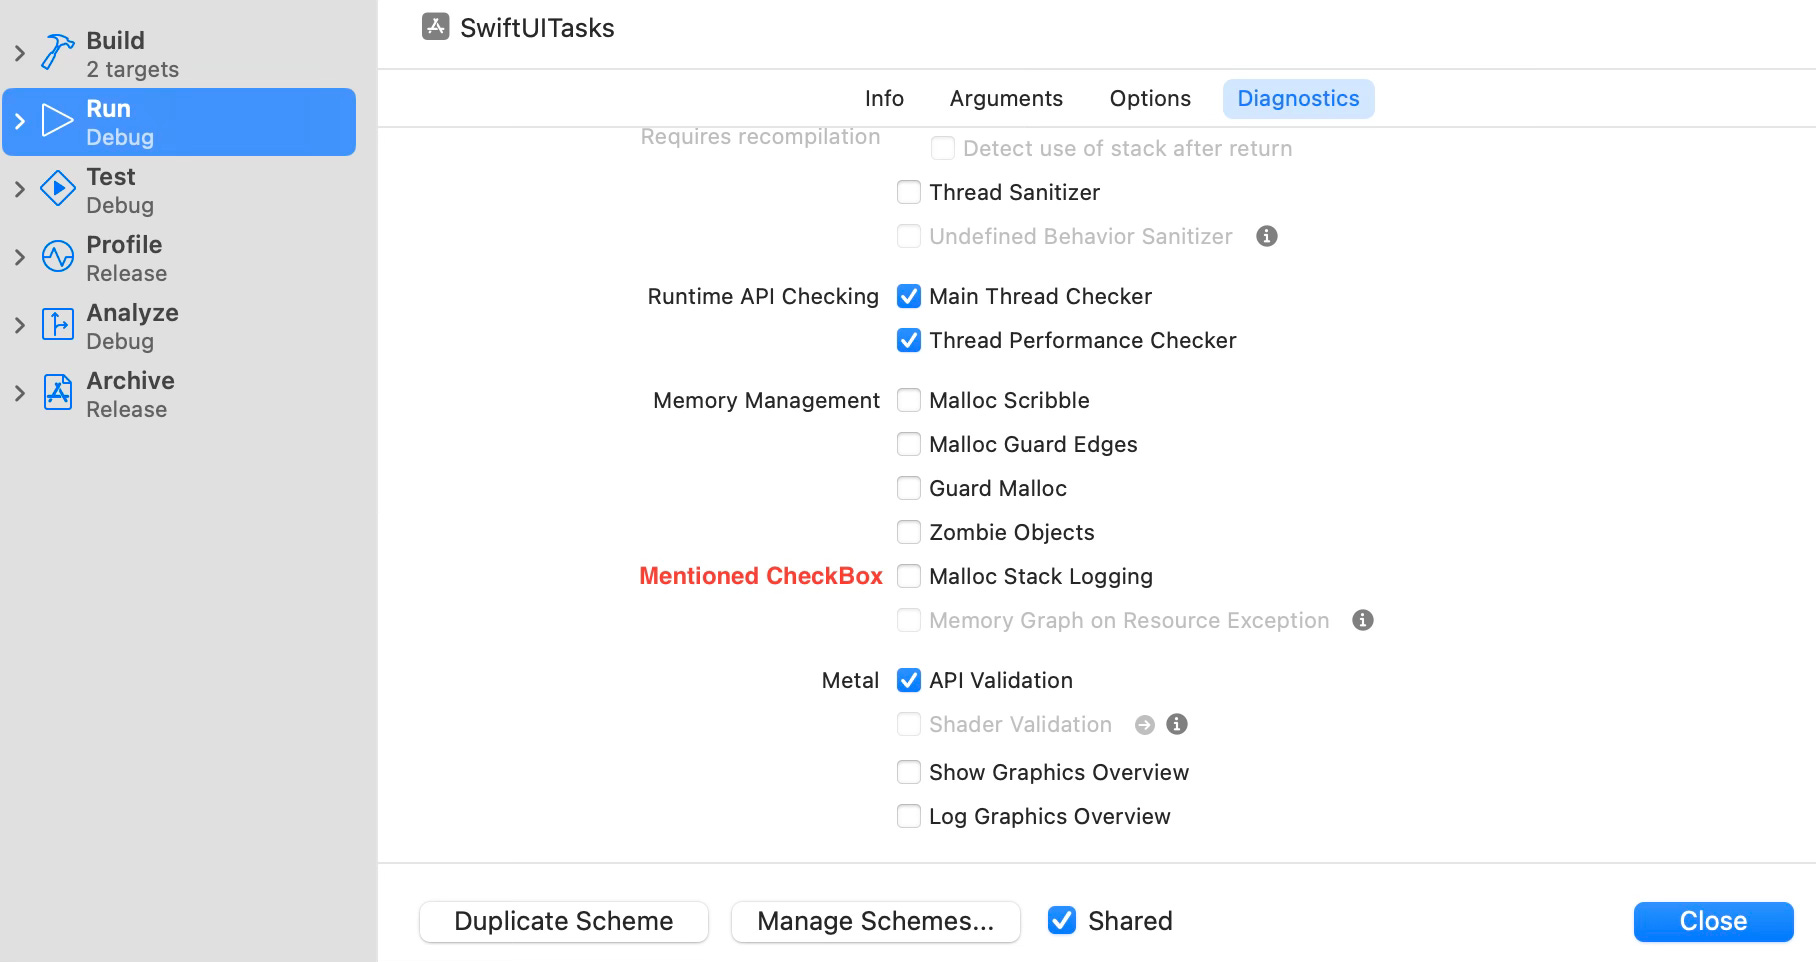
Additionally Swift.org docs suggesting to enable old Zombie Objects from Objective-C legacy from the same menu.
And no one really talk about it widely that Swift is also available on Linux and you can profile the heap with different tools there. Read according section of the Swift docs here.
Allocations instrument
Last but not least - Instruments tool. You can open it via Product - Profile:
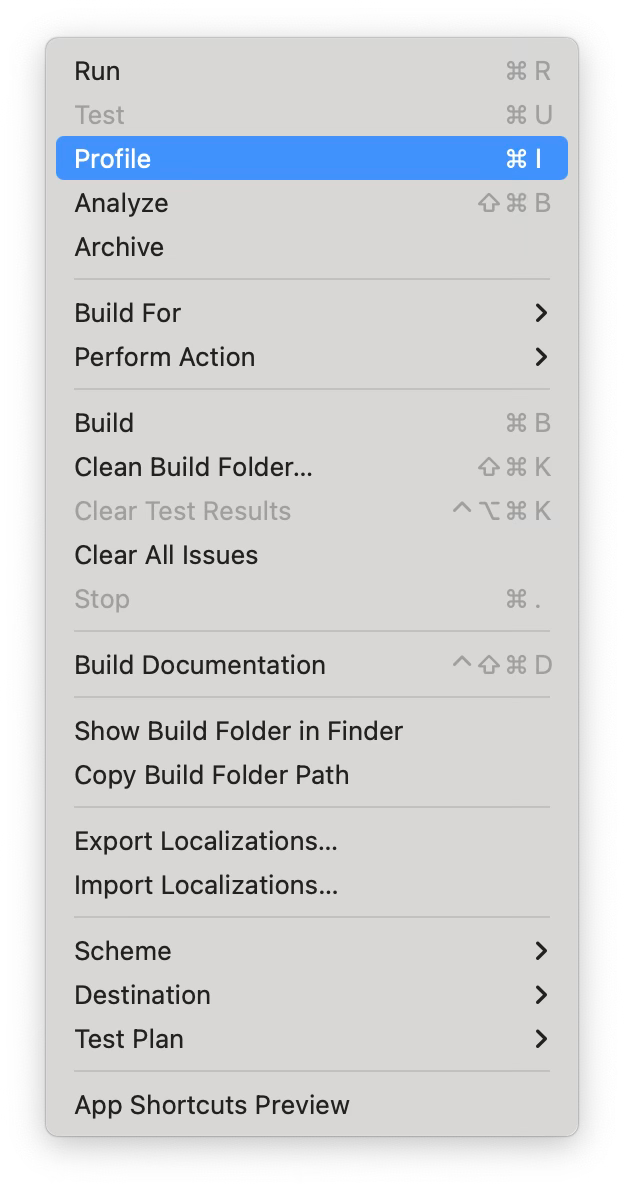
And then pick the required mode for targeted profiling. Usually Allocations is the best one to start.
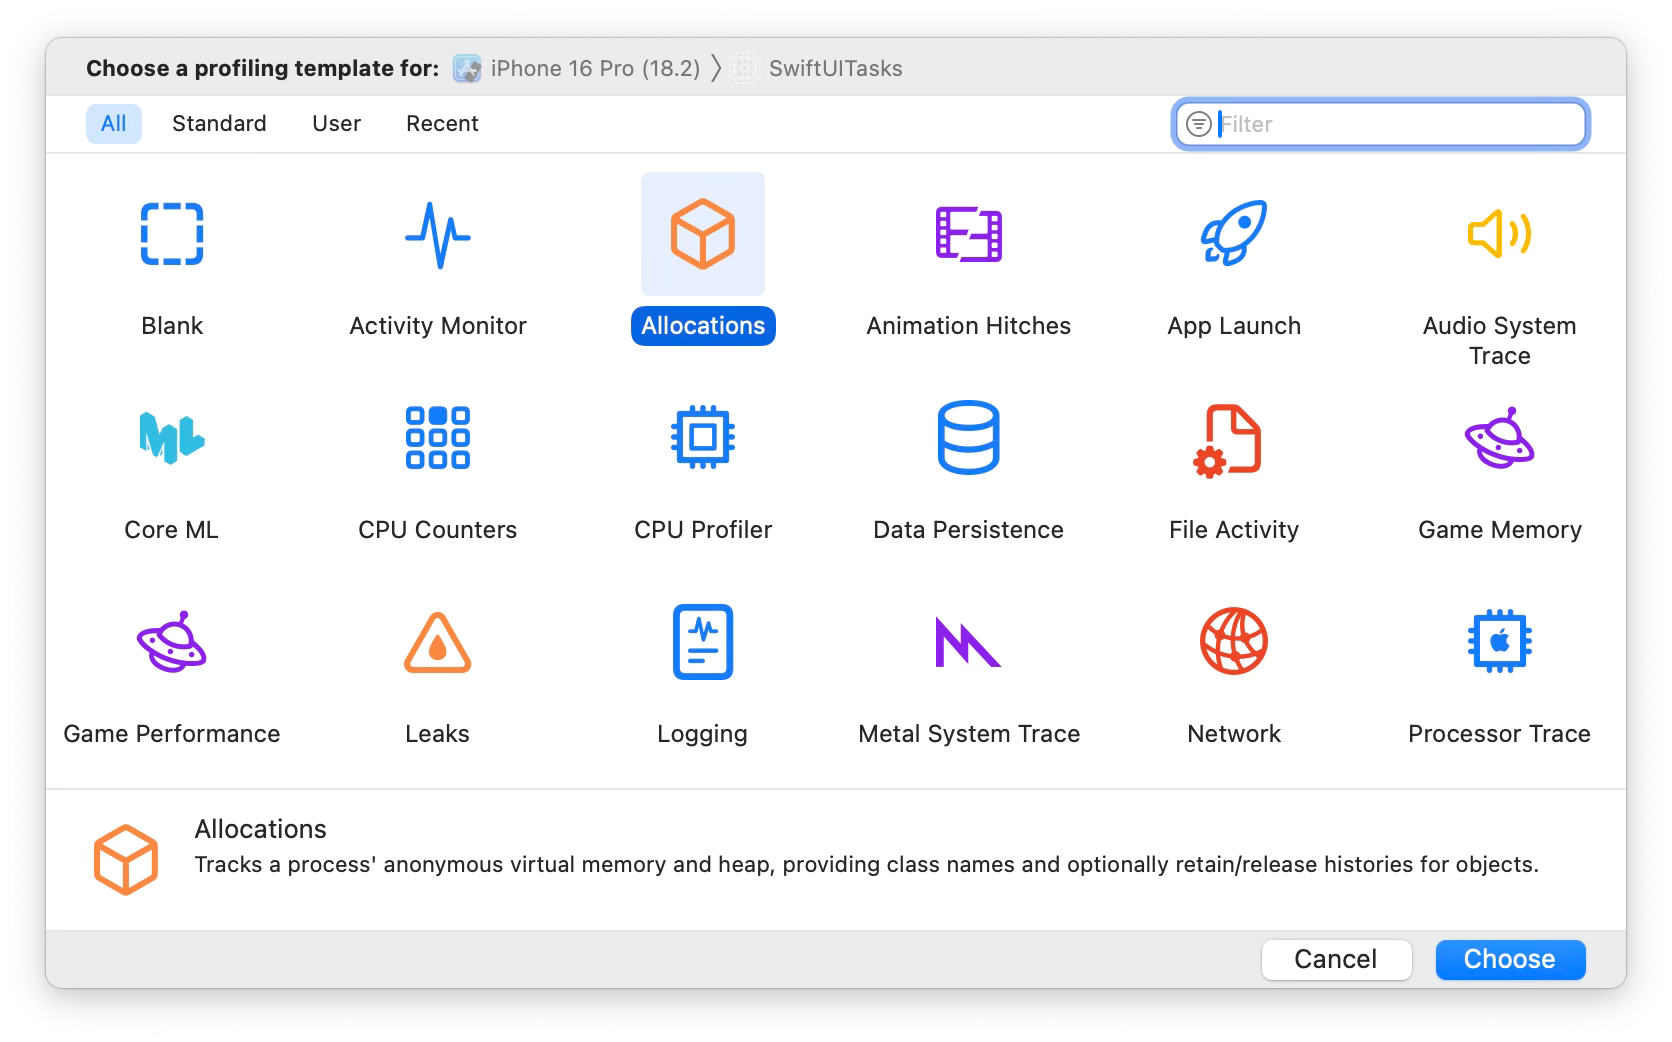
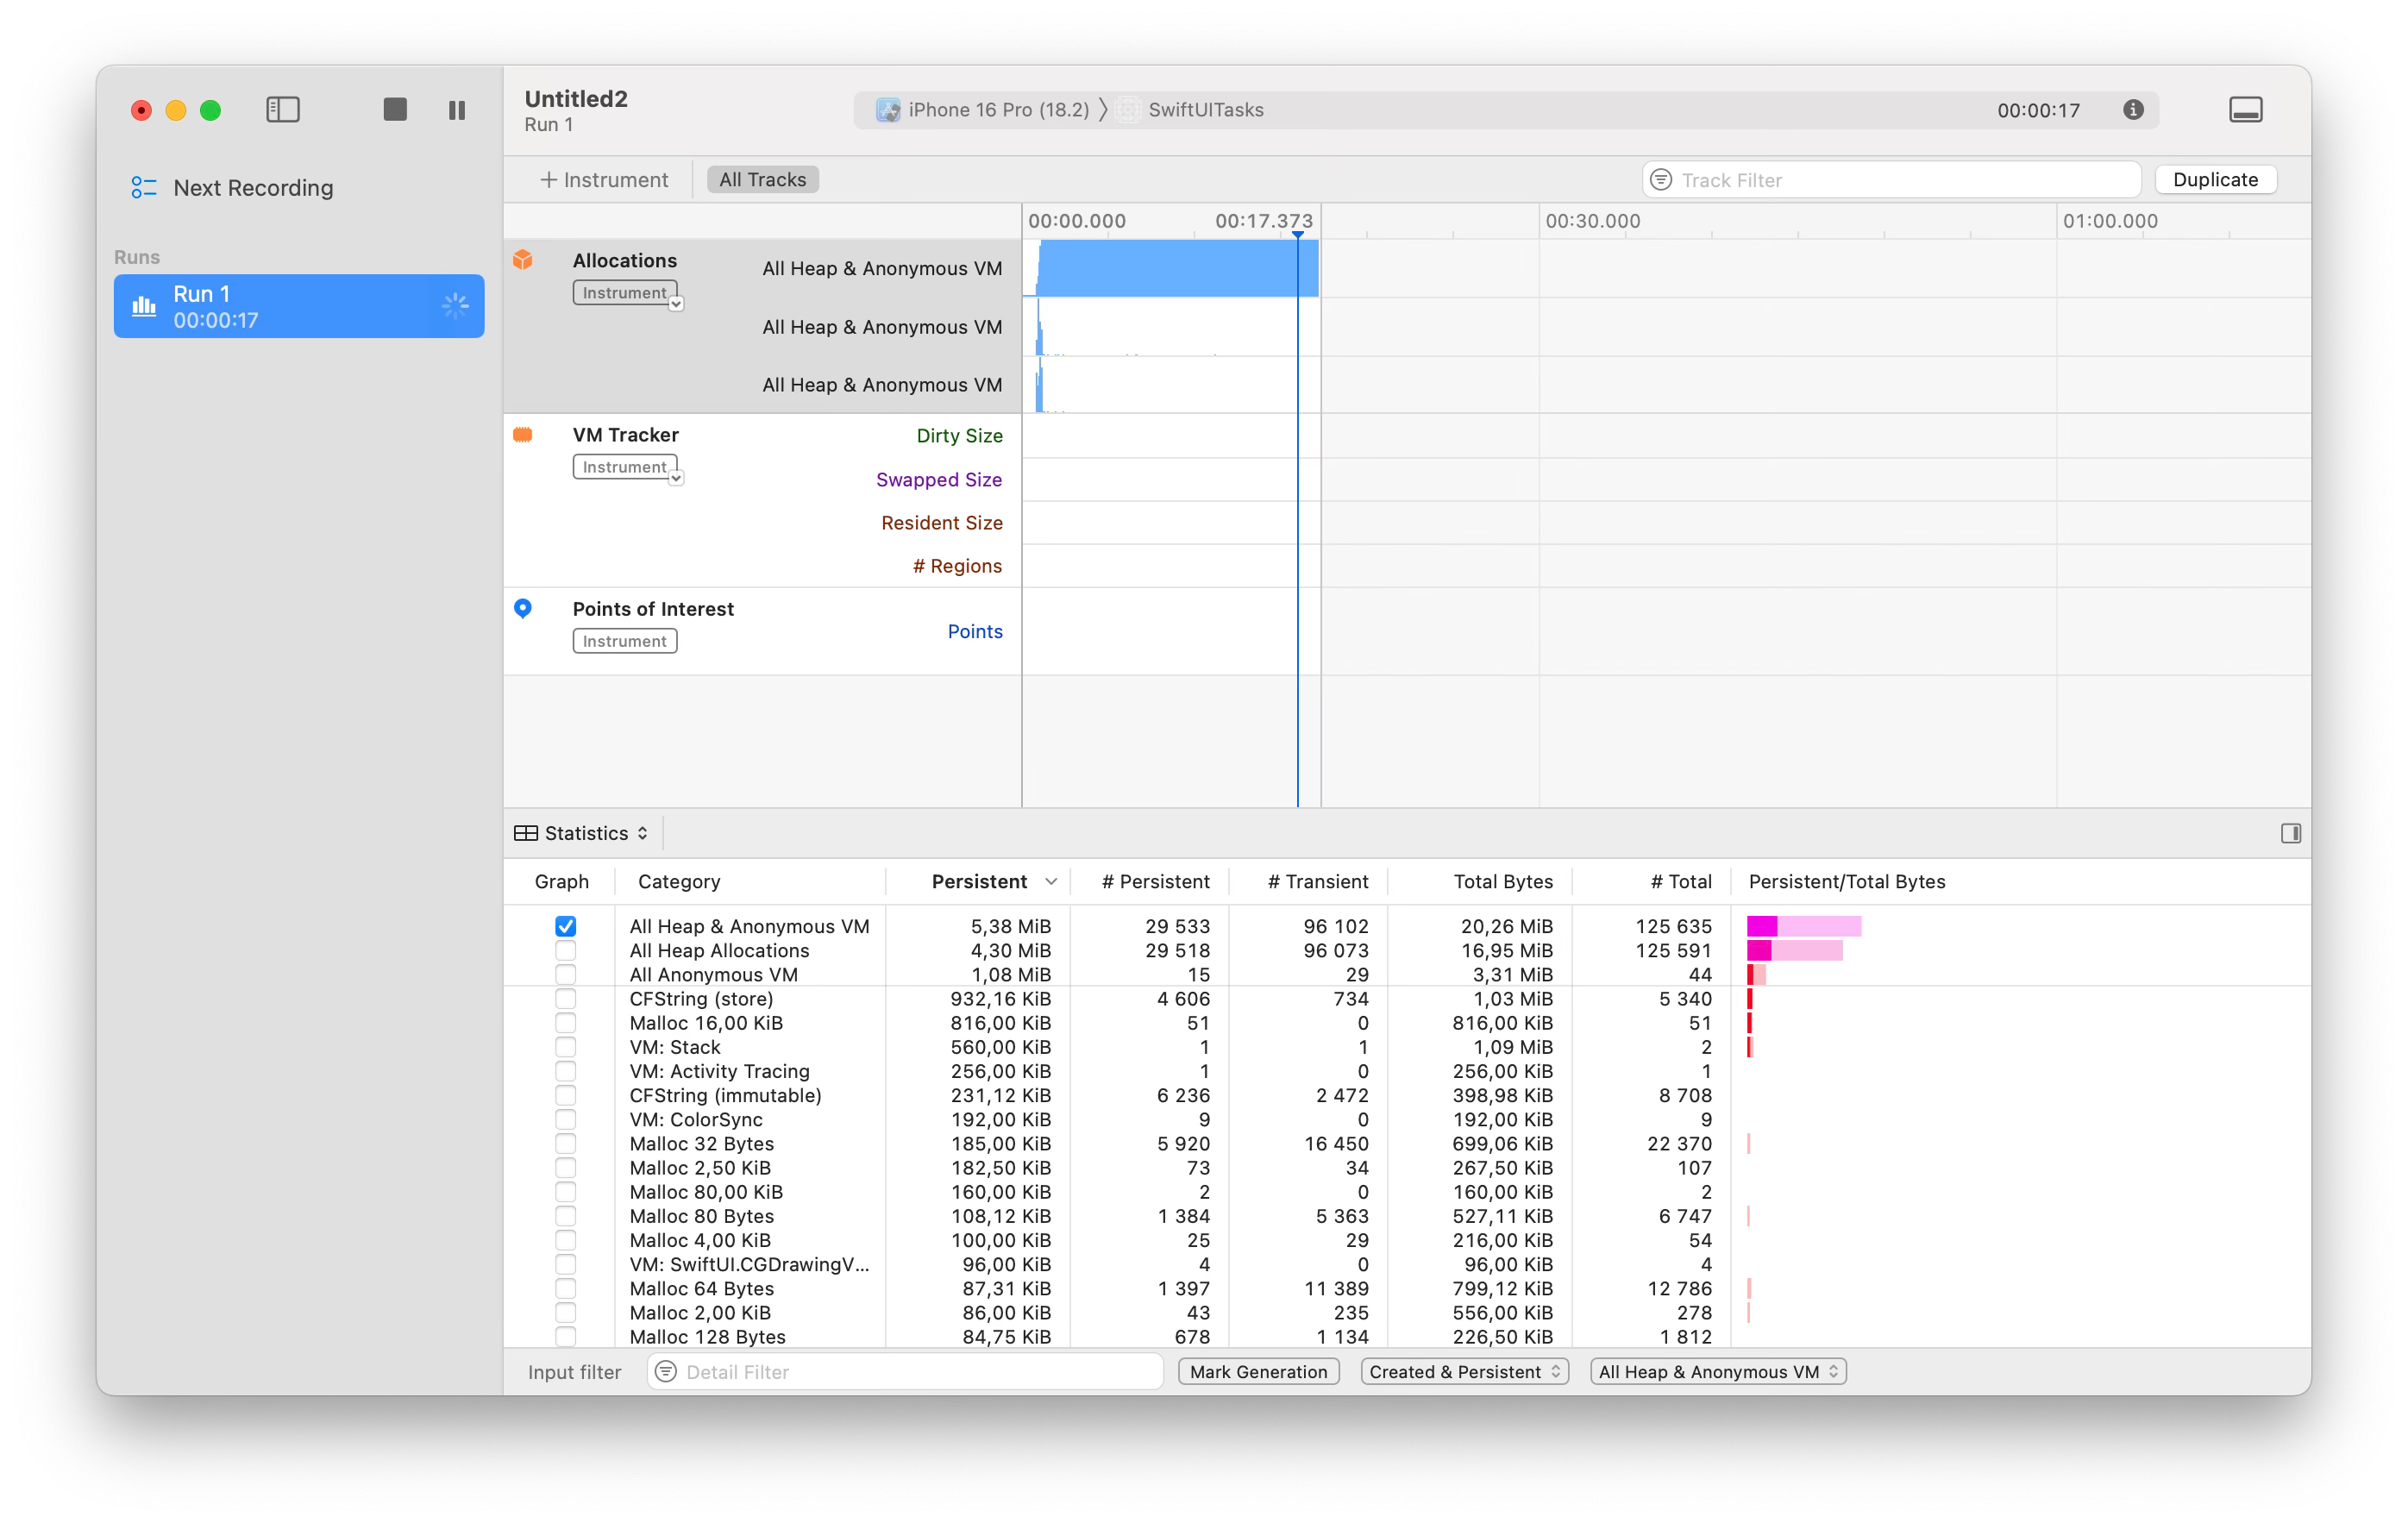
The Allocations instrument tracks the size and count of all heap and anonymous VM allocations, grouped by category. Use its timeline to observe how your app’s total allocated memory changes during interaction. The statistics view shows categories of allocations, their counts, and sizes. Click the arrow next to a category to view individual allocations, their timestamps, and the code responsible for each allocation.
Conclusion
Now that we understand how memory is allocated, measured, and what tools are available for analysis, it’s time to explore how to manage high memory usage. In the next part, we’ll dive into methods and tools for optimizing memory efficiency. Stay tuned!
Great stuff. And check out https://github.com/naftaly/Footprint for a way to track all this at runtime and use it for the benefit of your users.