
SwiftUI: Charts Interactivity - Part 1
Add selection for data representation

In the previous post, we’ve made a discardable slider to prevent extra data writes and logic triggering. Project is growing and now we need to represent the stored data in an understandable and appealing way - charts (if it can be applied to charts at all). Now it’s become more convenient with Swift Charts Framework.
Before iOS 16, we had to use custom charts or implement them on our own. Some of the popular solutions were::
MPAndroidChart port, which is now called DGCharts because of name conflict with native one
SwiftUICharts for easy implementation
AAChartKit-Swift and it’s still very popular and as you might notice that it’s a port of Android AAChartKit
SwiftCharts, without maintainer now for months
As you can see, Android chart libraries (even though they’re custom components) inspired a lot of these solutions. Many popular apps used the mentioned ports. What can I say: a very popular and famous companies have gained their users by implementing the Chart Component and sell it. Not a secret, that TradingView is a leader in charting controls and have their performant implementation.
The ice began to melt at WWDC22, when Apple introduced Swift Charts. Here is the session to get you started and get a brief overview. For those who want an official docs:
That would be enough to get a basic knowledge about the Charts for us to start.
Plain Chart
Let’s create a data array and scatter chart for it. We will show a daily chart of humidity.
struct HumidityRate: Identifiable {
    let humidity: Double
    let date: Date

    var id: Date { date }
}
For convenient testing, we can add an initializer with date offset and extension:
struct HumidityRate: Identifiable {
    let humidity: Int
    let date: Date

    var id: Date { date }

    init(minutesOffset: Double, humidity: Int) {
        self.date = Date().addingTimeInterval(minutesOffset * 60)
        self.humidity = humidity
    }
}

extension HumidityRate {
    static var samples: [HumidityRate] {
        [
            .init(minutesOffset: -3, humidity: 10),
            .init(minutesOffset: -2, humidity: 10),
            .init(minutesOffset: -1, humidity: 10),
            .init(minutesOffset: 0, humidity: 20),
            .init(minutesOffset: 1, humidity: 30),
            .init(minutesOffset: 2, humidity: 40),
            .init(minutesOffset: 3, humidity: 50),
            .init(minutesOffset: 4, humidity: 40),
            .init(minutesOffset: 5, humidity: 30),
            .init(minutesOffset: 6, humidity: 20),
            .init(minutesOffset: 7, humidity: 10)
        ]
    }
}
Now it’s time for the chart. Construction is pretty simple. At least for now ) We will pass data and use LineMark to draw a line and PointMark to place dots.
struct HumidityChartViewDemo: View {

    let data: [HumidityRate]

    var body: some View {
        Chart(data, id: \.date) { rate  in
            LineMark(
                x: .value(”“, rate.date),
                y: .value(”“, rate.humidity)
            )

            PointMark(
                x: .value(”“, rate.date),
                y: .value(”“, rate.humidity)
            )
        }
        .frame(height: 400)
        .padding()
    }
}

#Preview {
    let data: [HumidityRate] = HumidityRate.samples
    HumidityChartView(data: data)
}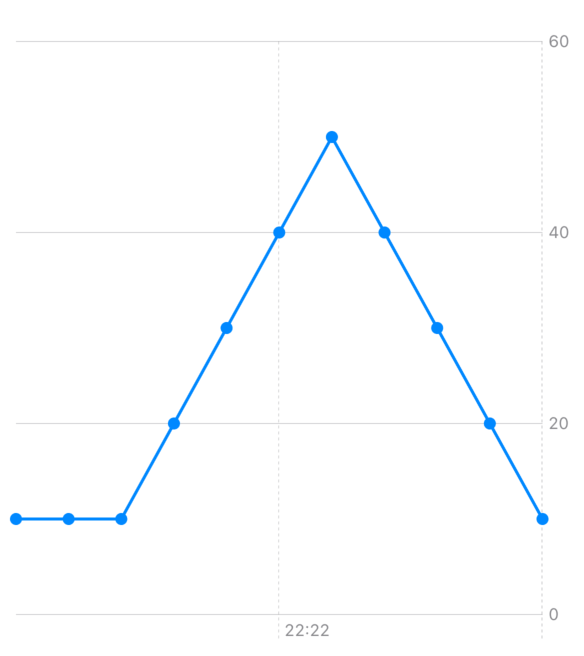
Isn’t it simple? Yes! Informative - not really ) We can start with colors which are very handy to highlight the values. Values before the current time would have smaller weight and opacity. And smooth interpolation for edges polishing. Which will lead to an interesting turnaround later.
struct HumidityChartView: View {
    let data: [HumidityRate]

    var body: some View {
        Chart(data, id: \.date) { rate  in
            LineMark(
                x: .value(”“, rate.date),
                y: .value(”“, rate.humidity)
            )
            .interpolationMethod(.catmullRom)
            .foregroundStyle(LinearGradient(colors: data.compactMap({Color.colorForIndex($0.humidity)}), startPoint: .leading, endPoint: .trailing))

            PointMark(
                x: .value(”“, rate.date),
                y: .value(”“, rate.humidity)
            )
            .foregroundStyle(Color.colorForIndex(rate.humidity))
            .annotation(position: .top) {
                Text(”\(rate.humidity)”)
                    .font(.headline)
                    .fontWeight( rate.date < Date() ? .regular: .bold)
                    .opacity( rate.date < Date() ? 0.5 : 1.0)
            }
        }
        .frame(height: 400)
        .padding()
    }
}

extension Color {
    static func colorForIndex(_ humidity: Int) -> Color {
        switch humidity {
        case 0..<20: return .green
        case 20..<50: return .yellow
        case 50..<70: return .orange
        case 70...80: return .red
        default: return .purple
        }
    }
}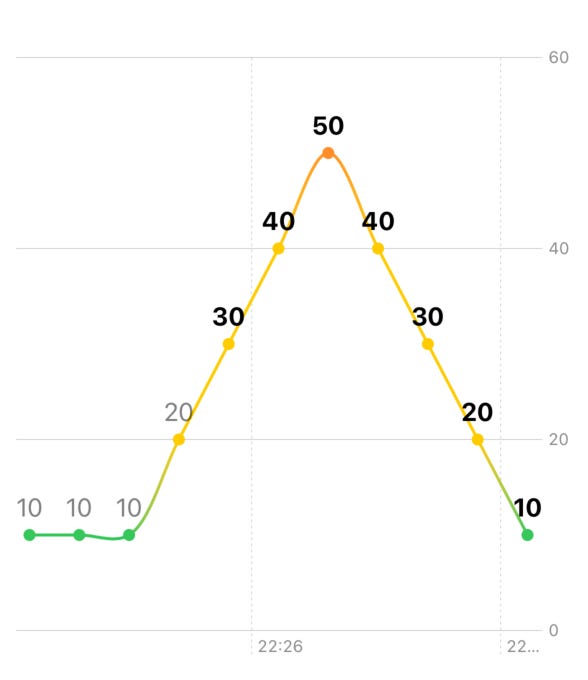
LinearGradientshould have the same amount of points as data samples!
All looks great. Perhaps filling the gap below the chart with AreaMark will bring more visibility.
struct HumidityChartView: View {

    let data: [HumidityRate]

    var body: some View {
        Chart(data, id: \.date) { rate  in
            //Area highlight
            AreaMark(x: .value(”“, rate.date),
                     y: .value(”“, rate.humidity))
            .foregroundStyle(LinearGradient(colors:
                                                data.compactMap({
                Color.colorForIndex($0.humidity)
            }),
                                            startPoint: .leading,
                                            endPoint: .trailing))
            .interpolationMethod(.catmullRom)

            LineMark(
                x: .value(”“, rate.date),
                y: .value(”“, rate.humidity)
            )
            .interpolationMethod(.catmullRom)
            .foregroundStyle(LinearGradient(colors: data.compactMap({Color.colorForIndex($0.humidity)}), startPoint: .leading, endPoint: .trailing))

            PointMark(
                x: .value(”“, rate.date),
                y: .value(”“, rate.humidity)
            )
            .foregroundStyle(Color.colorForIndex(rate.humidity))
            .annotation(position: .top) {
                Text(”\(rate.humidity)”)
                    .font(.headline)
                    .fontWeight( rate.date < Date() ? .regular: .bold)
                    .opacity( rate.date < Date() ? 0.5 : 1.0)
            }
        }
        .frame(height: 400)
        .padding()
    }
} 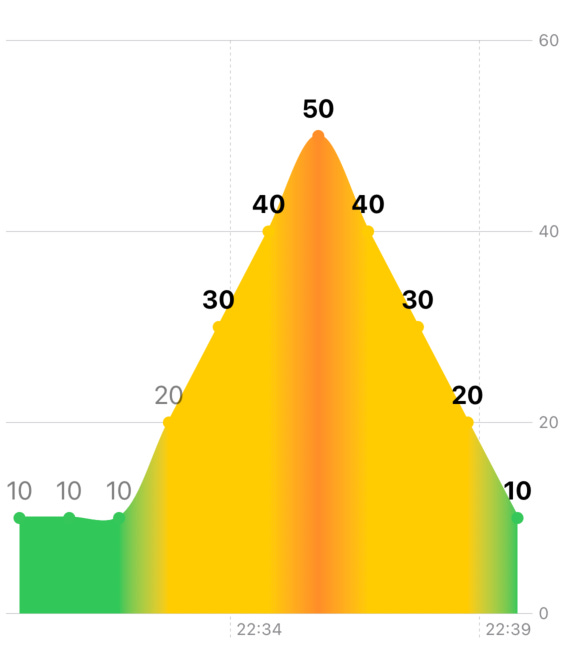
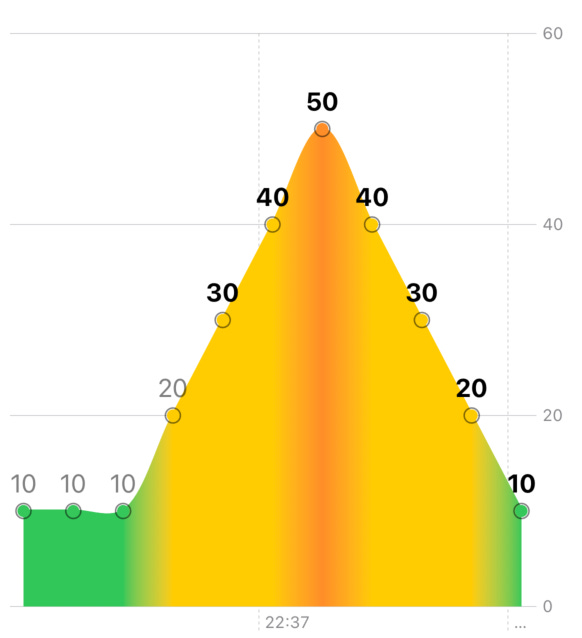
Unfortunately, that merged the points with AreaMark. This can be fixed by adding extra annotation to the PointMark:
.annotation(position: .automatic, alignment: .center, spacing: -9.0) {
    Circle()
         .stroke(Color.black.opacity(0.5), lineWidth: 1)
}
Selection
Starting from iOS 17, framework contains selection handling for each of the axis.
nonisolated public func chartXSelection<P>(value: Binding<P?>) -> some View where P : PlottableBefore that, we had to place an overlay and track which values were available at the exact location. For a small, not complicated selection it might work. By adding RuleMark, vertical line can be drawn with time for the selected X-value:
struct HumidityChartViewDemo: View {

    @State private var selectedX: Date? = nil

    let data: [HumidityRate]

    var body: some View {
        Chart(data, id: \.date) { rate  in
            AreaMark(x: .value(”“, rate.date),
                     y: .value(”“, rate.humidity))
            .foregroundStyle(LinearGradient(colors:
                                                data.compactMap({
                Color.colorForIndex($0.humidity)
            }),
                                            startPoint: .leading,
                                            endPoint: .trailing))
            .interpolationMethod(.catmullRom)

            LineMark(
                x: .value(”“, rate.date),
                y: .value(”“, rate.humidity)
            )
            .interpolationMethod(.catmullRom)
            .foregroundStyle(LinearGradient(colors: data.compactMap({Color.colorForIndex($0.humidity)}), startPoint: .leading, endPoint: .trailing))

            PointMark(
                x: .value(”“, rate.date),
                y: .value(”“, rate.humidity)
            )
            .foregroundStyle(Color.colorForIndex(rate.humidity))
            .annotation(position: .top) {
                Text(”\(rate.humidity)”)
                    .font(.headline)
                    .fontWeight( rate.date < Date() ? .regular: .bold)
                    .opacity( rate.date < Date() ? 0.5 : 1.0)
            }.annotation(position: .automatic, alignment: .center, spacing: -9.0) {
                Circle()
                    .stroke(Color.black.opacity(0.5), lineWidth: 1)
            }

            if let selectedX {
                RuleMark(x: .value(”Selected”, selectedX))
                    .annotation(position: .automatic) {
                        VStack(spacing: 0) {
                            Text(selectedX, style: .time)
                        }
                    }

            }
        }
        .chartXSelection(value: $selectedX)
        .frame(height: 400)
        .padding()
    }
}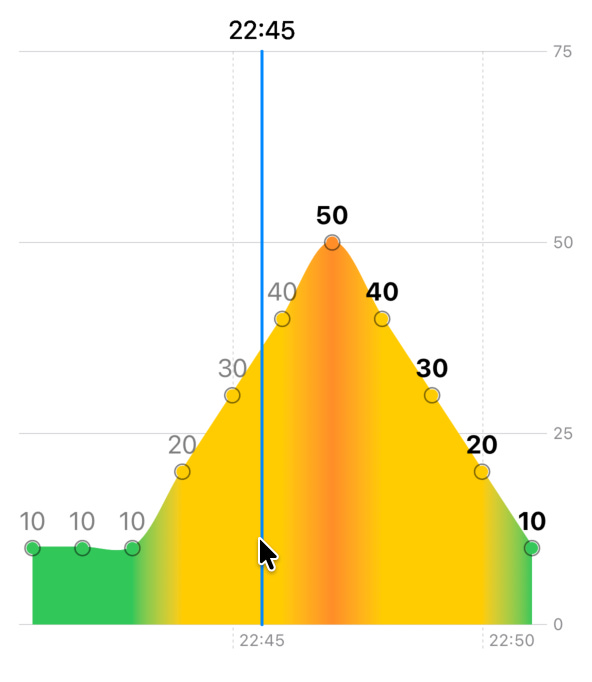
Also, this recalculates the Y-axis to show selection more clearly. To remove it, we can strict the domain (by calculating max + 10 on Y-axis):
.chartYScale(domain: 0...(min(100, data.map(\.humidity).max() ?? 0) + 10))We are moving pretty well! Fixing axis labels would be a good milestone, don’t you think? Right now we can’t even tell what time is it.
Axis Labels
First, we need to show the date values. Time earlier than current should have lower opacity. For this, we need to use chartXAxis. According to docs, it used for configuring the X-axis with ChartAxisContent.
AxisMarks(
    position: .bottom, values: data.compactMap(\.date)
){ value in
    if let date = value.as(Date.self) {
        AxisGridLine(stroke: .init(lineWidth: 1))

        AxisValueLabel {
            VStack(alignment: .center) {
                Text(date, format: .dateTime.hour().minute())
                    .font(.footnote)
                    .opacity( date < Date() ? 0.5 : 1.0)
            }
        }

    }
}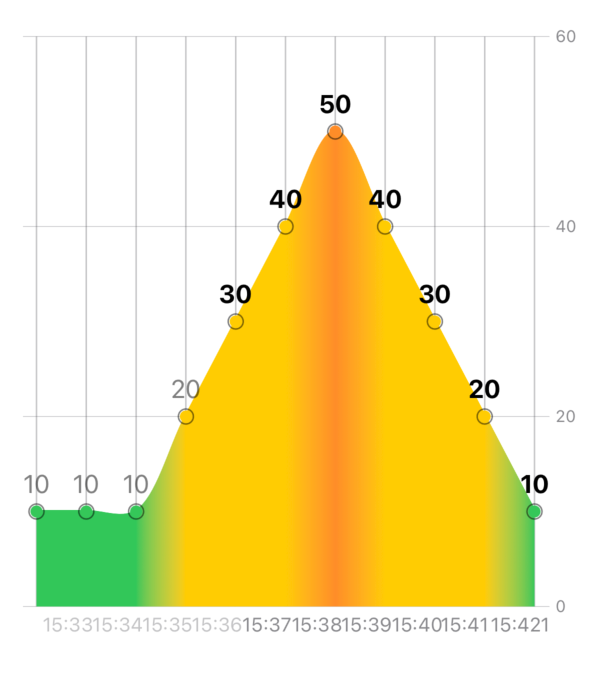
Well, that is not ideal. Sometimes too many info is not needed. Showing only even dates and skip last date. Small extension will help us.
extension Array {
    func evenIndexed() -> Self {
        self.enumerated()
            .compactMap { index, element in
                index.isMultiple(of: 2) ? element : nil
            }
    }
}

.chartXAxis(content: {
        AxisMarks(
            position: .bottom, values: data.compactMap(\.date)
        ){ value in
            if let date = value.as(Date.self) {
                AxisGridLine(stroke: .init(lineWidth: 1))
                if data.compactMap(\.date).evenIndexed().contains(date) && data.compactMap(\.date).last != date {
                    AxisValueLabel {
                        VStack(alignment: .center) {
                            Text(date, format: .dateTime.hour().minute())
                                .font(.footnote)
                                .opacity( date < Date() ? 0.5 : 1.0)
                        }
                    }
               }
            }
        }
    })
Now we can get humidity axis. As with X-axis, without iterating over values - nothing will work. Humidity values can be calculated with this formula:
Array(stride(from: 0, to: min(100, (data.map(\.humidity).max() ?? 0) + 10), by: 10)
.chartYAxis {
    AxisMarks(
        position: .trailing,
        values: Array(
            stride(
                from: 0,
                to: min(100, (data.map(\.humidity).max() ?? 0) + 10),
                by: 10
            )
        )
    ) { value in
        if let number = value.as(Int.self) {
            // 20 and 50 are border values to highlight
            if [20, 50].contains(number) {
                AxisGridLine(stroke: .init(lineWidth: 2))
                    .foregroundStyle(Color.colorForIndex(number))

                AxisValueLabel {
                    VStack(alignment: .leading) {
                        Text(”\(number)”)
                            .fontWeight(.bold)
                    }
                }
                .foregroundStyle(Color.colorForIndex(number))

            } else {
                AxisGridLine(stroke: .init(lineWidth: 1))

                AxisValueLabel {
                    VStack(alignment: .leading) {
                        Text(”\(number)”)
                    }
                }
            }
        }
    }
}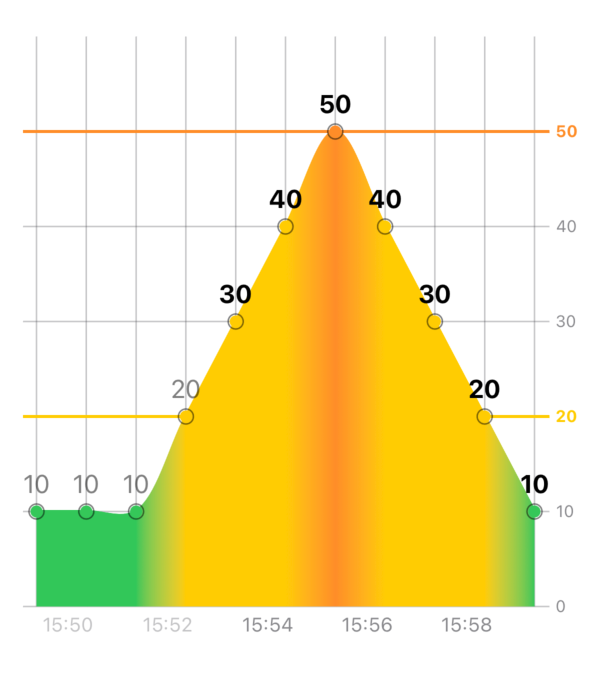
This is a great foundation for our upcoming styling and research. The next post will cover selection tweaks. You will find why did we use interpolation after all.
Thanks for reading and stay tuned for the next part!